
The Platform Performance page shows sales and delivery activity for each platform during a selected period. It includes a sales chart and a table for comparing platform figures.
Go to Sales Analytics → Platform Performance to open the page.
Select a Date Range
Use the date range picker to choose the period you want to review. The default is the last 30 days, including today. The chart and table update when you change the dates.
Sales by Platform #
The Sales by Platform chart compares Sales Amount across platforms. Each bar represents a platform’s sales during the selected period, with the highest sales amount shown first.
A platform with no sales amount does not appear in the chart, even if it has delivery activity shown in the table.
Platform Metrics #
The Platform Metrics table shows platforms that had successful orders or file deliveries during the selected period. It displays:
- Platform – The platform’s name.
- Orders – The number of successful orders.
- Sales Amount – The amount from successful orders.
- Refund % – Refunded amount divided by sales amount. A dash appears when there is no sales amount to calculate a percentage.
- Files Sent – Delivered files or codes; resends are excluded.
Select Orders, Sales Amount, Refund %, or Files Sent in the table header to rank platforms by that figure. The highest figure appears first. The default ranking is Sales Amount.
Where access is available, click Download CSV to export the table’s platform figures. The CSV also includes the refunded amount.
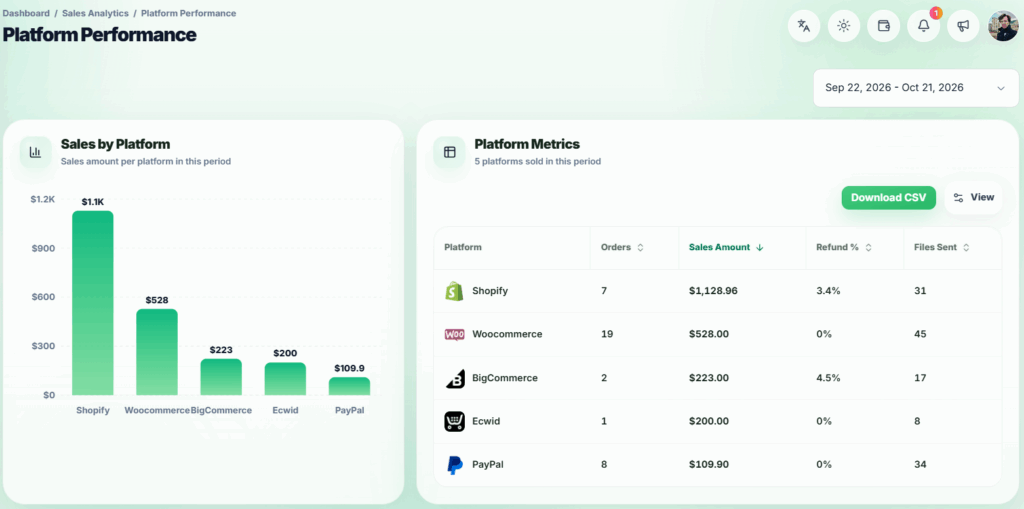
Platform Performance page