
The Sales Analytics Overview gives sellers a summary of sales activity across their connected platforms. It shows key figures, sales charts, and the top inventory items, stores, and customers.
To open it, go to Sales Analytics → Overview.
Filter the Overview
Use the date range picker to choose the period you want to review. The page opens with the last 30 days, including today, selected by default.
Use the Platform filter to view one platform, or select All Platforms to view them together. Changes to either filter update the relevant figures automatically.
The date range also shows the immediately preceding period of the same length for comparison.
Sales Summary
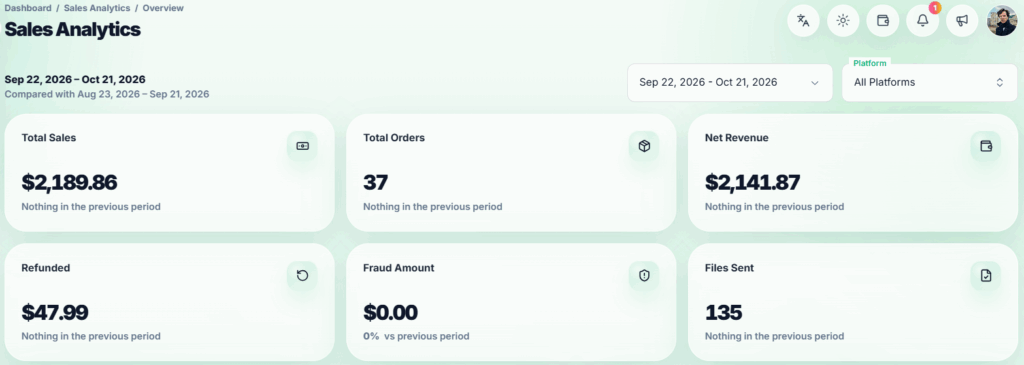
The cards at the top show:
- Total Sales – The total amount of successful orders.
- Total Orders – The number of successful orders.
- Net Revenue – Total Sales minus the refunded amount.
- Refunded – The amount refunded during the selected period.
- Fraud Amount – The amount associated with orders marked as fraud.
- Files Sent – The number of delivered files or codes. Resends are excluded from this figure.
Each card compares its figure with the preceding period when a comparison is available.
Sales Trend #
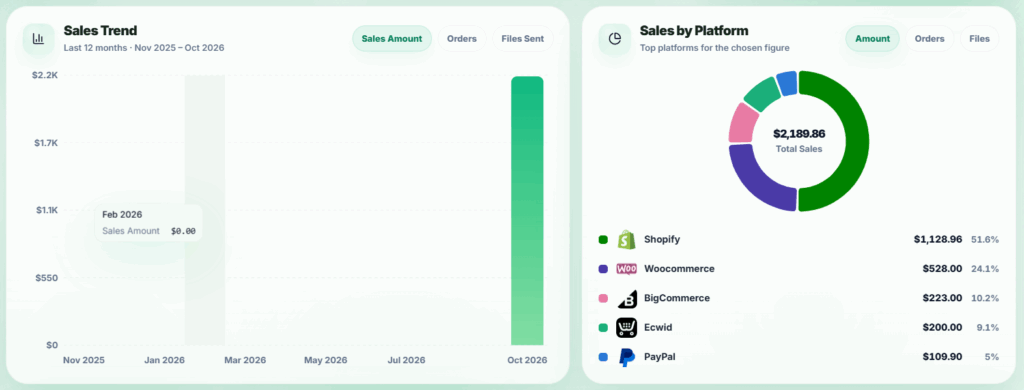
The Sales Trend chart shows monthly activity for the last 12 months, including the current month so far. You can switch between Sales Amount, Orders, and Files Sent.
This chart follows the selected Platform, but it always uses its own 12-month period, regardless of the date range selected at the top of the page.
Sales by Platform #
Sales by Platform shows how activity is divided between platforms for the selected date range. Switch between Sales Amount, Orders, and Files Sent to view each platform’s figure and share.
This section follows both the selected date range and Platform filter.
Daily Sales #
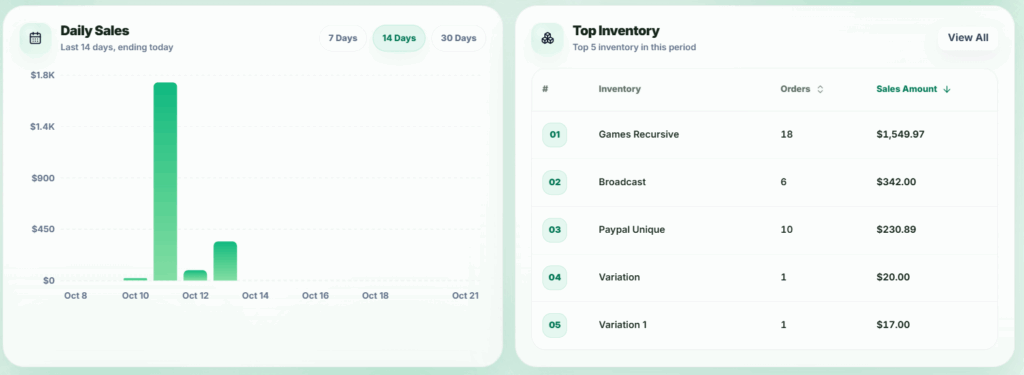
The Daily Sales chart shows sales amount by day. Choose the last 7, 14, or 30 days; the default is 14 days. Each option ends today.
Daily Sales follows the selected Platform, but uses its own day setting instead of the date range selected at the top of the page.
Top Inventory, Stores, and Customers #
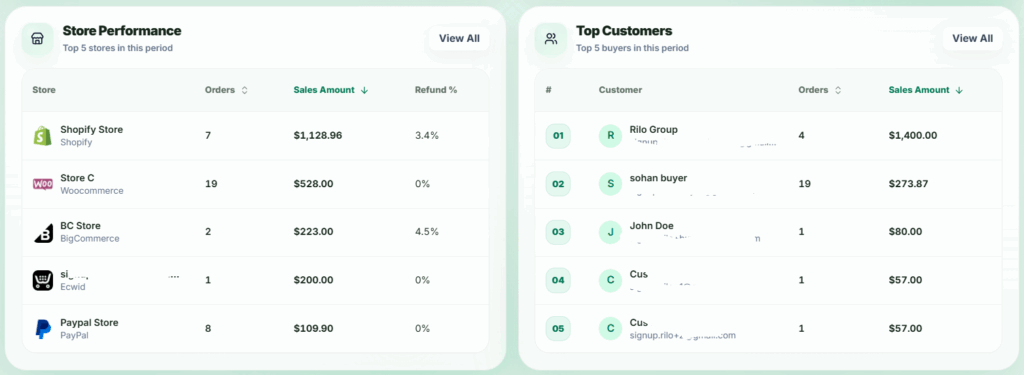
Three tables show up to five entries each for the selected date range and Platform:
- Top Inventory – Inventory name, order count, and sales amount.
- Store Performance – Store and platform, order count, sales amount, and refund percentage.
- Top Customers – Customer, order count, and sales amount.
The tables are ranked by Sales Amount by default. Select the Orders column to rank a table by order count. Each table has a View All link to its full report, when the seller has access to that report.
Sales Analytics page