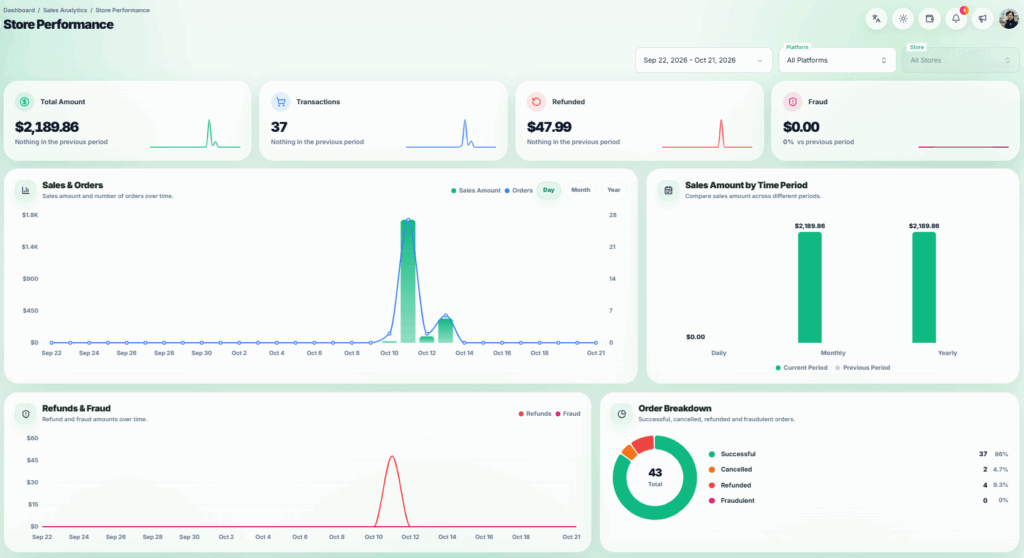
The Store Performance page helps sellers review sales activity across their stores. It includes an overview of the selected stores, a chart of the top stores by sales, and a detailed comparison table.
Go to Sales Analytics → Store Performance to open the page.
Select a Date Range, Platform, and Store
At the top of the page, choose a date range, Platform, or Store. The default date range is the last 30 days, including today. Select a platform before choosing one of its stores.
The Platform and Store selections apply to Stores Overview only. The date range applies to the Stores Overview summary cards and Order Breakdown, as well as the Top 5 Stores by Sales chart. Other charts and the Store Details table use their own time periods, described below.
Stores Overview #
The summary cards show figures for the selected date range and stores:
- Total Amount – The amount from successful orders.
- Transactions – The number of successful orders.
- Refunded – Refunds recorded during the selected period.
- Fraud – The amount associated with orders marked as fraud.
The cards compare these figures with the immediately preceding period of the same length.
Stores Overview also includes:
- Sales & Orders – Sales amount and successful orders over time.
- Sales Amount by Time Period – Sales amount for today versus yesterday, this month so far versus last month, and this year so far versus last year.
- Refunds & Fraud – Refunded and fraud amounts over time.
- Order Breakdown – Counts of successful, cancelled, refunded, and fraudulent orders in the selected date range.
Use the Day, Month, or Year setting on the Sales & Orders chart to change the time grouping for both Sales & Orders and Refunds & Fraud. These charts use fixed windows ending in the current day, month, or year: the last 30 days, 12 months, or 5 years, respectively. They do not use the date range selected at the top of the page.
Top 5 Stores by Sales #
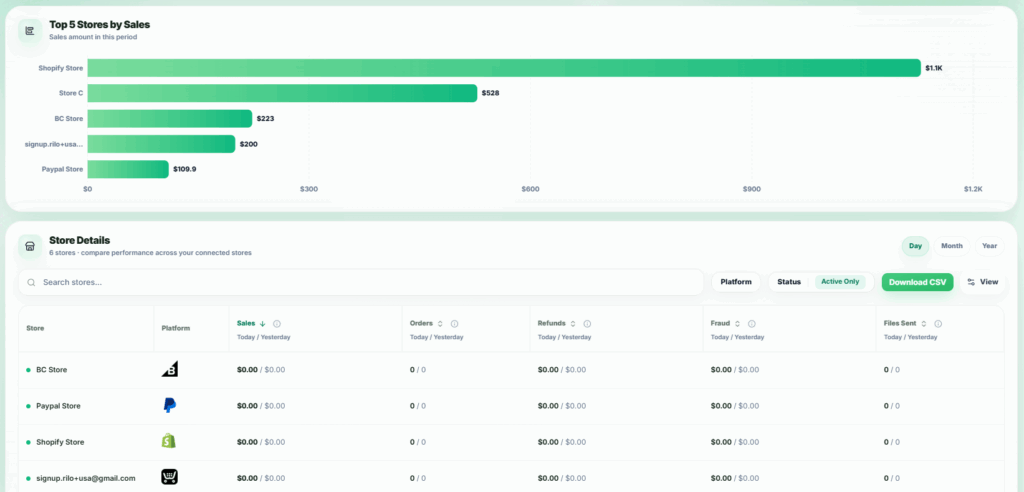
The Top 5 Stores by Sales chart shows up to five stores with the highest sales amount in the date range selected at the top of the page.
The chart includes stores with a positive sales amount. It follows the selected date range, but the Platform and Store selections above Stores Overview do not filter this chart.
Store Details #
The Store Details table compares connected stores across two periods. Select:
- Day – Today versus yesterday.
- Month – This month so far versus all of last month.
- Year – This year so far versus all of last year.
Day is selected by default. The table uses this setting independently of the date range at the top of the page.
The table shows each store’s Sales, Orders, Refunds, Fraud, and Files Sent for the current and previous periods. It also shows the store name, platform, and active or inactive status. A connected store can appear with zero figures when it had no activity in either period.
Use Search stores, Platform, and Status to narrow the table. The default status filter is Active Only. Select a figure’s column heading to rank stores by its current-period value; the highest value appears first. The default ranking is Sales.
Use the table controls to change pages or rows per page. Where access is available, Download CSV exports the filtered store comparison, including both periods’ figures.